High Probability ETF Trading: 3-day High/Low Method
-
Clearly Described Trading Strategies
(5)
-
Verifiable Statistical Edge
(5)
-
Easy to Read
(5)
-
Cost
(5)
Summary
High Probability ETF Trading: 7 Professional Strategies to Improve Your ETF Trading was published in 2009. The clearly defined and quantified strategies contained within this book are a fertile playground of trading discovery. In a world where financial ideas are quick to stale–the strategies contained within this book have stood the test of time. Today’s article is an overview of the book, and the first of several blog posts. Where I will be testing and writing about each strategy in high detail. Today, we are going to explore the 3-day High/Low Method. Nearly all trading related books are a horrible waste of time and money. This book is not. This book should be part of the foundation in which to build your trading career upon. Highly recommended. And it’s dirt cheap.
Thanks for reading today’s review of High Probability ETF Trading: 7 Professional Strategies to Improve Your EFT Trading
I have a confession. I am a sucker for trading books. They say that “You should never judge a book by its cover.” Yet this is exactly what I do.
And I cannot stop myself. The more pretty the cover, the higher the likelihood that I will furiously jab the ‘Buy Button.’
Patiently I wait for the book to arrive in the mail. It does. And then I excitedly begin reading the pages. Hoping to find the ‘holy grail’ of trading. I never do.
Most Trading Books Suck
The hard and cold truth about trading books…nearly all of them are terrible. And I mean 99.99% are just horrible. In fact, sometimes I cry tears of pain because a poor tree had to sacrifice itself to provide a canvas on which to print upon.
What about returning the trading book to the book store? Or mailing it back to Amazon? Ditto. Who has the time for that?
Another problem with trading books in the modern age is that most are now delivered digitally. So once you download the book, you are now the irrevocable owner. What a pain.
Some Trading Books are Good
Some trading books are actually quite good. Foundational. But they are very rare.
What makes a great trading book? In my opinion, an excellent trading book contains the following:
- A set of clearly defined strategies with exact rules that can be backtested.
- Less trading ‘truisms’ and Woulda-Coulda-Shoulda chart examples.
- No fancy mathematics or complicated formulas that confuse and imply “I am smart, and you are not.”
- No upsell. In other words, the book is not ‘bait’ to purchase yet more expensive products or services.
Today, I want to talk about a book that was published in 2009. I purchased the book in 2010. It’s a beauty. A foundational type book.
The name of the book is High Probability ETF Trading: 7 Professional Strategies to Improve Your ETF Trading. The author of the book is Larry Connors and Cesar Alvarez.
Before we go any further, I want to notify that audience that I have include an Amazon affiliate link. The cost of the book is $9.99 with Kindle or $29.99 hardback. If you purchase this book through Amazon, I will earn 30 cents. Yes, the grand sum of 30 cents. Just wanted everyone to understand that I am in for a huge payday. Okay, got that out of the way, let’s get started on this…
A foundational type book
The book is only about 120 pages in length. A short book. However, it is rich in robust trading strategies. There are 7 complete strategies that needed to be hand-coded and tested. And each strategy needed to be tested on a portfolio of Exchange Traded Funds in various asset classes. Yes, it was time-consuming.
If I were to write a single blog post on this book, and included all 7 strategies, then the blog post would easily be 20k to 30k words in length. Far to much content for a simple book review. In fact, it would be longer than the book itself.
So, I am going to break the book into several blog posts that talk about each strategy and also reveal the individual performance.
I want you to think about this book as a foundation. Something that will serve as a launch pad for your own research. I truly believe that this book, if properly consumed will put you light years ahead of your competition.
Why Exchange Traded Funds?
This book was originally published in 2009, and it talked about the rapidly growing universe of ETF’s or Exchange Traded Funds.
Since the publishing of this book, the ETF universe has exploded in size and complexity. There is an ETF available for just about every possible investment niche. Even the transgender have their own ETF!
Probably the most recognizable and popular ETF is the SPY which is currently commanding (August 2017) about 63 million shares traded daily. A big, deep, and wide market.
What exactly is an ETF? Essentially, it is a basket of stocks grouped together into a common theme. For instance, the SPY ETF can be purchased as a single share. Each SPY ETF share contains a tiny portion of every stock contained within the SP500.
There are several other advantages of trading ETF’s which include:
- Safer than individual stocks. Ever been on the wrong side of a fraudulent corporate earnings report? Chief Executive Officer caught in bed with a prostitute–a male prostitute? Then you know what I am talking about! (Enron 2001)
- ETF’s can be traded on both the long side and the short side.
- ETF’s can be traded with leverage or without leverage.
In a nutshell, an EFT provides protection from corporate risk. If a single stock within the ETF plunges due to fraud or poor earnings, then the related basket of stocks within the ETF will help to soften the blow.
Portfolio of ETF’s
In the book: High Probability ETF Trading: 7 Professional Strategies to Improve Your ETF Trading, the authors of the book used a basket of 20 highly diversified ETF’s. The ETF universe of 2008 is hardly recognizable to the 2017 ETF universe.
However, to keep the spirit of the book intact, we are going to keep the original portfolio for testing purposes. The advantage is that we can see just how well everything has performed since the publishing of the book.
The following table is the complete list of ETF’s. I have also included an outgoing link that gives a highly detailed explanation of the ETF, directly from the ETF provider.
| Symbol | Linked to Complete Description | Quick Description |
| DIA | Diamonds Trust | The Dow Jones Industrial AverageSM (DJIA) is composed of 30 “blue-chip” U.S. stocks. |
| EEM | iShares Emerging Markets | Exposure to large and mid-sized companies in emerging markets. |
| EFA | iShares MSCI EAFE | Exposure to a broad range of companies in Europe, Australia, Asia, and the Far East. |
| EWH | iShares Hong Kong | Exposure to large and mid-sized companies in Hong Kong. |
| EWJ | iShares Japan | Exposure to large and mid-sized companies in Japan. |
| EWT | iShares Taiwan | Exposure to large and mid-sized companies in Taiwan. |
| EWZ | iShares Brazil | Exposure to large and mid-sized companies in Brazil. |
| FXI | iShares China | Exposure to large and mid-sized companies in China. |
| GLD | SPDR Gold Shares | The first US traded gold ETF and the first US-listed ETF backed by a physical asset. |
| ILF | iShares Latin America | Exposure to large, established companies in Latin America. |
| IWM | iShares Russell 2000 | Exposure to small public U.S. companies. |
| IYR | iShares Dow US Real Estate | Exposure to U.S. real estate companies and REITs, which invest in real estate directly and trade like stocks. |
| QQQ | PowerShares NASDAQ 100 | Exposure to largest non-financial stocks on Nasdaq. |
| SPY | SPDR SP500 | The S&P 500 Index is a diversifed large cap U.S. index that holds companies across all eleven GICS sectors. |
| XHB | SPDR SP500 Home Builders | Exposure to home building products and producers. |
| XLB | SPDR Materials | Exposure to materials producers: chemical, construction, packaging, mining, paper, etc. |
| XLE | SPDR Energy Sector | Exposure to the energy sector of the SP500. |
| XLF | SPDR Financial Sector | Exposure to insurance, banks, thrifts, RE trusts, mortgage finance, consumer finance of SP500. |
| XLI | SPDR Industrial | Exposure to defense, aerospace, marine, machinery, airlines and air freight. |
| XLV | SPDR Health Care | Exposure to pharmaceuticals, health care equipment, health care related produces and services. |
As you can see, this list of ETF’s encompasses a broad spectrum of asset classes and locales. If something is moving on planet earth, this list of ETF’s should catch the move.
Ok, so now we know the portfolio of ETF’s that we will be testing, let’s move on to Strategy A of the book.
Strategy A: The 3-Day High/Low Method
The following are the exact rules, for the long side only.
- Today the ETF is above the 200-day moving average.
- Today the ETF closes below its 5-day moving average.
- Two days ago the high and low price of the day is below the previous day’s high and low.
- Yesterday the high and low price of the day is below the previous day.
- Today’s high and low price is below yesterday’s.
- Buy on the close today.
- Exit on close when the ETF closes above its 5-day simple moving average.
You may look at this list of rules and be thinking, “wow this sure seems complicated.” But it’s not. It is actually a very simple daily bar pattern. Below, I have included a screen capture of what the pattern looks like:
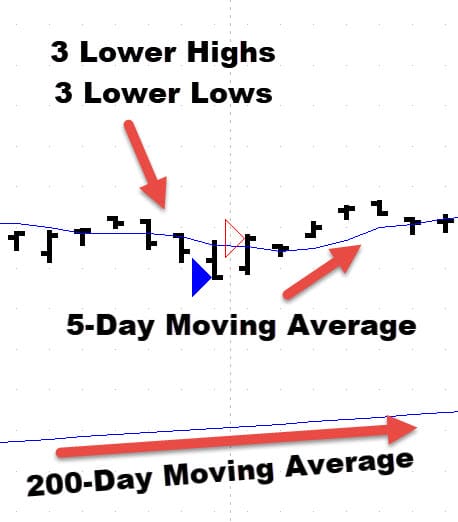
What a stupid simple pattern. You are simply looking for the 3-bar pattern. Entering on the close. Exiting at a close above the 5-day moving average.
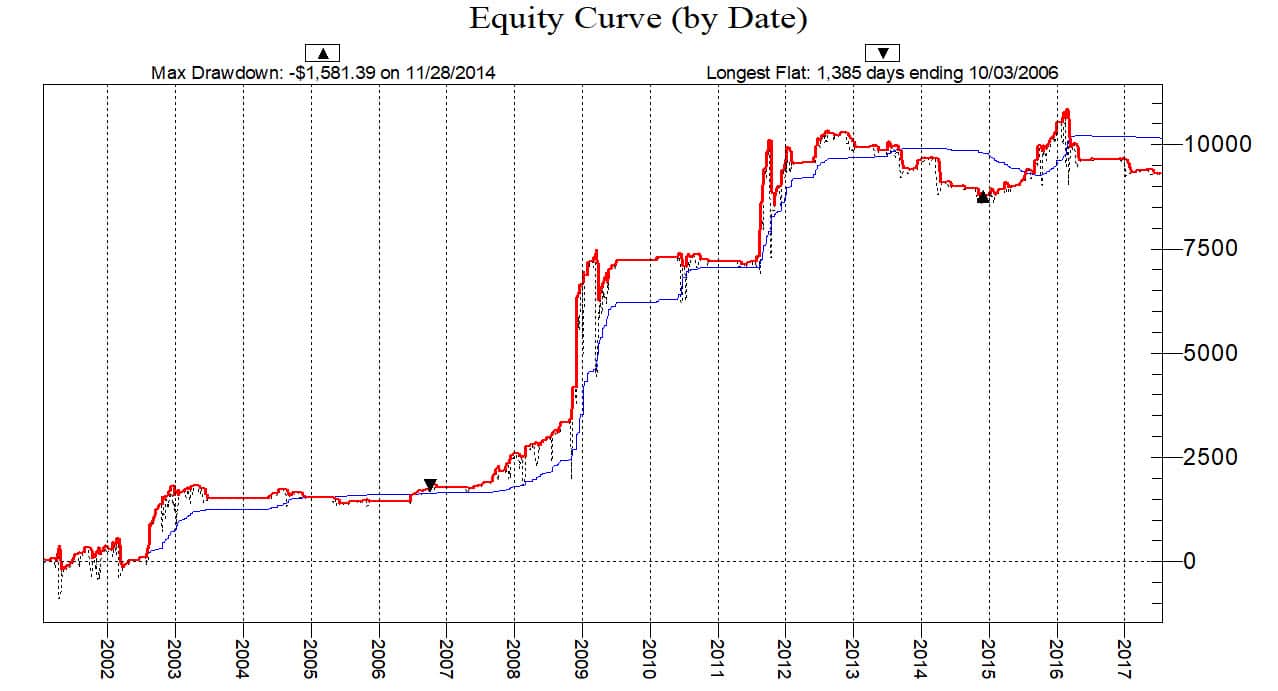
The following results assume that a person invests $2,000 per trade.
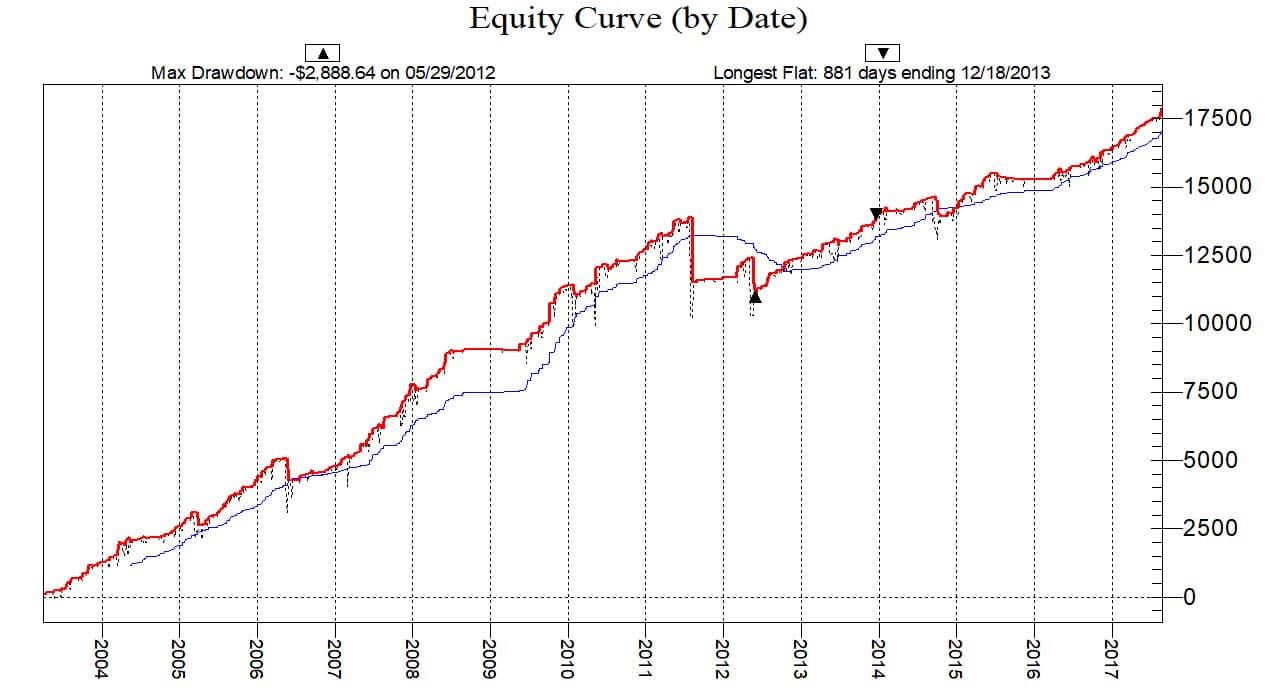
Looking at this equity curve, you should notice two things:
- The book was published in 2009. No changes have been made to the original strategy or portfolio, yet it continues to generate robust profits.
- The big drawdown in 2011 was the Chinese stock market crash, which caused massive panic globally, yet the strategy continued to grind higher.
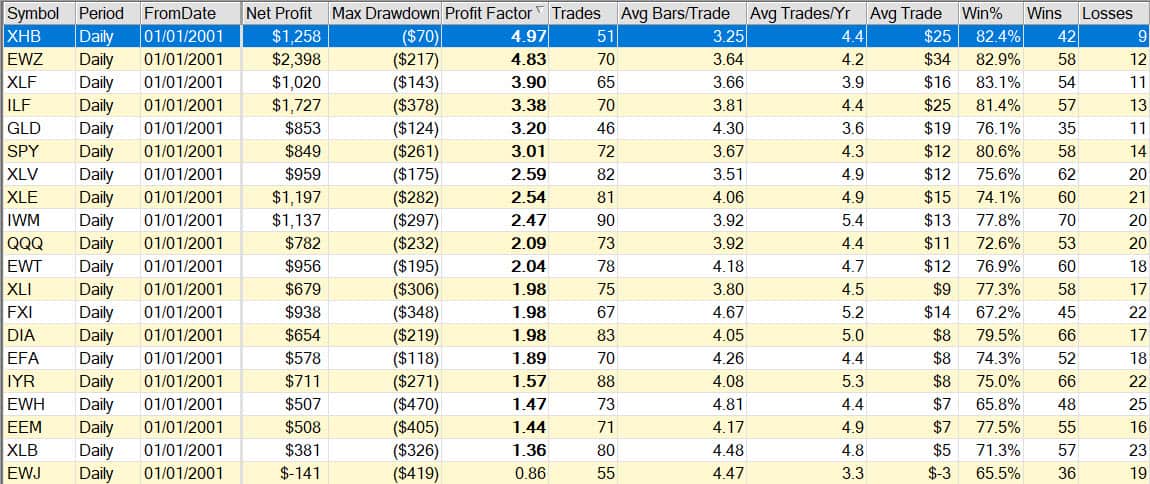
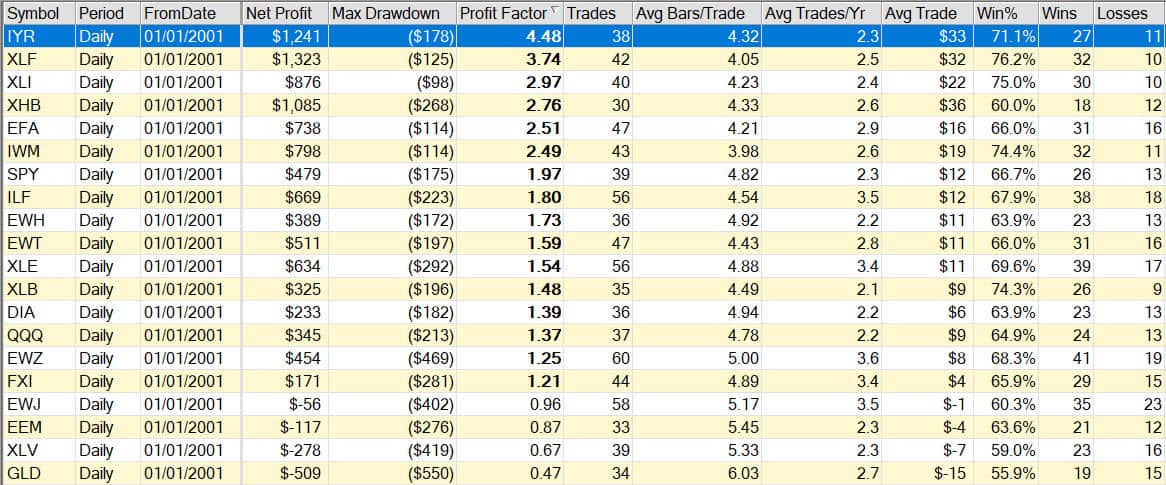
Now let’s dig deeper into the data and review the individual performance of each ETF:
Ok, now lets look at the short side.
The short side rules are the exact opposite of the long side rules.
The following are the exact rules, for the short side only.
- Today the ETF is below the 200-day moving average.
- Today the ETF closes above its 5-day moving average.
- Two days ago the high and low price of the day is above the previous day’s high and low.
- Yesterday the high and low price of the day is above the previous day.
- Today’s high and low price is above yesterday’s.
- Sell on the close today.
- Exit on close when the ETF closes below its 5-day simple moving average.
The following results assume that a person invests $2,000 per trade.
Some readers might be looking at this equity curve and thing to themselves, “Oh this is jagged and not very pretty.” For that I say…you are CRAZY! The truth is that this method has done a wonderful job at catching every market plunge. It caught the 2007-2008 housing crisis, it caught 2011 Chinese stock market crash, and it caught the deep pullback in 2015.
Now let’s dig deeper into the data and review the individual performance of each ETF:
Shorting the stock market has generally been a game for suckers. Nearly all global stock markets, over the long term, have continued to grind higher. Whenever you can find something that does a decent job of catching the sell offs, then you really need to take notice. I sure do. To me, the short side equity curve and performance table look beautiful. When the next market bust hits…I will be expecting a fast payday from this strategy.
Combining Long and Short with minimal risk.
Both the long side test, and the short side test assumed a minimal $2,000 investment. I purposely kept the amounts very small. Most TradingSchools.Org readers are playing with very small trading accounts. Typically, they will attempt to ‘day trade’ their small amount into a large amount, in a very short period of time. Nearly all will fail. Day trading is pretty much a death trap for newbies.
However, the 3-Day High/Low method is really a great option for small trading accounts. The typical losing trade is usually less than $50. So you can get your feet wet, without putting your life at risk.
Another advantage is that you don’t really need any fancy or expensive trading software to execute and trade this method. Once you internalize what the pattern looks like, you can visually scan a chart in a few seconds looking for the setup.
Yet another advantage is that you don’t need to be glued to a trading screen all day. Since all of the entries and exits occur on the close, then you typically need to check for entries and exits about 20 minutes before the stock market closes. Simple and stress-free.
Wrapping Things Up
In the following blog posts, I will be introducing yet more of the strategies contained within this excellent book. As good as these strategies are…this isn’t really where the magic happens.
The real magic is when you take these strategies and add the element of your own unique imagination. There are hundreds of portfolio combinations and minor permutations that can be applied. I love volatility filters. Without giving away the store, I can assure you that adding a volatility filter will supercharge the results–but you need to do the work.
If are interested in having this strategy, or any other strategy that I write about coded and ready to deploy, then simply download a free copy of Trade Navigator. I will forward the strategies to your inbox, simply import and away you go.
Thanks for reading. Quite a long blog post. Congratulations for stumbling through my poorly written article.


I have Trade Navigator and would like to try out the code. Could you please send it to me? Thank you in advance.
Just purchased Trade Navigator and a bunch of Larry’s books and would like to take you up on the offer of getting the coded strategy ready to import via email. 🙂
Hi Mark,
Great to hear you are taking the first step towards automation, proper research, self-reliance, and avoiding Gurus. Every once a year (or longer), someone reaches out to me and asks “hey how can I do this myself” but instead they usually ask, “which Guru do you recommend?” To which I hardly ever reply. But this is definitely a message I need to reply to.
So you probably just downloaded Trade Navigator? Did you download the Platinum version? Let me know if you are in the trial version, etc, as this lets me know how much time I have to get you up and running. I don’t want you to spend a bunch of money on a platform if it’s not a good fit.
However, if you did purchase Navigator, then I would prefer to create a short free course that walks you through the setup, building a portfolio of symbols to test, writing the code as it is presented in the book, and then analyzing the results. I would anticipate it would take me a week to get this onto my website. This way, you have some structure, and you can share the ideas and process with anyone else that wants to learn.
Let me know.
PS: If you don’t have the book that I used in the article. That is ok as well.
-Emmett
Wow. That would be amazing. I did in fact buy the Platinum version as of late last week so am at the start of the 30 day trial period. I loaded up on LC’s books including the one from the article so no shortage of interesting systems to test and add my own spice to (i.e. volatility filters!) once I get the hang of Trade Navigator. Really appreciate your time and the reply.
I should have mentioned, I used CRM software many years ago that had a database query tool with logic very similar to how Trade Sense seems to be structured. In the interest of not wasting your time I’m pretty sure I could get by with an example or two of the LC systems you coded plus referring to the Trade Sense manual. Though I would certainly study the heck out of a free course if you take the plunge to create something for the community. 🙂
i tried tradenavigator on your recommendation specifically with the hopes of running this screen (and some others of Larry Connors’). as you say the screen is not hard to program with a little head-scratching and trial and error. and it worked, except that it only lets you run screens after the market has closed. If you want to check at 3:45pm, to make your purchases as the market closes (i trade mainly options, which can’t be done after hours.) it turns out that tradenavigator won’t run a screen with current info as if it’s the end of the day – not even at 3:45pm. this can severely limit your entries, unless you want to buy shares after hours – a bit unpredictable, shall we say?
about this screen – all of the etfs that came up on this particular day – they all gapped up the following day – some went higher, some went down, but – they all gapped up. pretty frustrating to not be able to get in at the end of the day, let me tell you.
Just tried the link to buy the kindle version and it appears to be gone. Did it disappear off of Amazon?
Sorry, please delete
Hi Emmett
Please send me the Trade Navigator coded strategies. Thanks.
Hi All,
Thank you Emmett and everyone for you contributions. This is a fantastic site. Have been slowly reading all the reviews, strategies and articles on the site.
Emmett could you please forward me your strategies. I know TradeStation and can convert all the strategies for you if you like and send the back.
I like learning new languages. So converting to NinjaTrader or MataTrader could be a good excuse to learn the languages.
Let me know if you are interested in me converting them to other languages.
Until now I have been an Algo Options trader. But going through your strategies has opened my eyes to new simpler ways of trading.
Thanks
Has anyone tested this on the shorter timeframes? 1hr, 15 min, 5 min?
Hey Emmett, great review..can you send me the strategy so I can back test? Thanks!
Sorry that entry code should read like this:
IF Close > MovingAvg (Close , 200) And Close High.2 And High.2 > High.1 And High.1 > High And Low.3 > Low.2 And Low.2 > Low.1 And Low.1 > Low
Hi Emmett, I programmed this one in as
IF Close > MovingAvg (Close , 200) And Close High.2 And High.2 > High.1 And High.1 > High And Low.3 > Low.2 And Low.2 > Low.1 And Low.1 > Low
and then to exit
IF Close > MovingAvg (Close , 5)
but it’s not coming back profitable for me. Perhaps I made an error in the coding?
Great read. I am learning so much from this website.
I see some people criticizing Emmett , he has presented strategies with backtested results, he is not just throwing ideas out there. So if you disagree with him atleast show some proof to support your statement/s , don’t just criticize him based on the assumptions in your head.
Guys, it is a scam 🙂
Strategy A. If there is no Stop Loss, it eventually close in profit (or above 5, but in loss), but your account may be wiped out by then. Just try it on historical data. Sometimes it will go 10 steps down, to move one step up. You may say, if its end up in profit, why should I worry? Well because, you don’t have unlimited account and your risk to reward may end up 5 to 1 not into your favor. Well roulette has better odds. This strategy simply says, after 3 days of falling it will retrace a bit. Cmon… It makes me think that strategy and most likely author of the blog have interests in promoting this book.
You have to take the initiative–test the strategy. Add a stop. Test it.
If you do not know how to program, then download
TradeNavigator for free, import the strategy and test it. But add a stop. See what happens.
I already know…
Emmett – how do we “import the strategy”…did you post it somewhere? Have not received it from you.
Your article says “…simply download a free copy of Trade Navigator. I will forward the strategies to your inbox, simply import and away you go.” How do we go about getting the strategies?
Just sent Jim. Make sure to lean on the Trade Nav guys in helping to set up a portfolio. As well as importing strategies, etc.
Can I please get the strategy sent to my email? Thanks!
Yet another great article/review by Emmett. There are simply too many people out there willing to trade garbage systems/”order flow reading” software that does not have a single stat to back up its claims. You can put a great set of backtested stats right in their face and they could careless. These folks deserve to lose their money. In a case of schadenfreude I have followed a blog of a girl who has traded with topstep for the last 2 or more years and has not made any money. She trades oil using “APA Zones”, a system which should be reviewed that has no stats to back anything up. The info that Emmett has given away for fee blows away this other stuff. Emmett please do a review of APA Zones and Jigsaw Trading. Their time has come.
Is this guy not just another of the, “I do not trade myself, but I can write books, and teach you how to make millions” guys?
Well put Cyn. That is the lingering question regarding anyone who runs an education website. Why are they doing that rather than throwing every cent that they have into their “cannot fail” trading systems. After looking at the results of the “good” trading educators identified on this site I can only conclude that their income from educating people is more certain and less prone to wild swings than income derived from trading.
I would love to know how you looked at the reviews on this site to reach the conclusion you did. Not saying you are right or wrong, but you’ve made a pretty specific and emphatic conclusion. What is your evidence for your conclusion?
What other conclusion can be reached? Why go through the headache of selling trading education except that the income from it is better than from trading the system they’re selling.
I guess when you just talk out yo a** you can draw any crazy conclusion you want. The concepts they teach in college level Business 101 would easily explain it, but to you the (incorrect) conclusion is obvious. I was hoping to have discussion, but this seems impossible with you.
Yes it’s impossible to have a discussion with someone who is determined to be a dickh#@* rather than contribute anything to the discussion. Did I say they weren’t trading? No I didn’t that’s your faulty logic and inability to understand what is written on the page in front of you. I posed the question of why wouldn’t they just trade their own cash using their system that’s so simple and profitable rather than deal with the headache of offering education which would bring with it having to deal with the occasional moron like you, dtchum. They’re not doing it to give back to the community, check the prices of the courses they sell, they’re expensive. I put forward the possibility of them selling education because the income derived from that could be more regular and perhaps greater than the income from their system. If you can suggest other reason do so rather than going to your default position of being a troll and trying to derail the discussion.
I notice in your diatribe you still have not addressed what exactly you saw in the good reviews to make you reach your conclusion: “After looking at the results of the “good” trading educators identified on this site I can only conclude…”
Please address the question – what results did you look at to draw your conclusion?
Did you bother to read the threads for some of those good trading educators? B12 Trader, a very honest trader but struggling to make a profit in trading. Another honest trader “Watch Him Trade” also struggling to make decent return on his trades but that may have changed. “Follow Me Trades” made 25% but there were questions raised about some of the trades he reported. 25% is great, fantastic but it’s still only $25,000 and his income from selling education could potentially, probably, be much greater than that. Kevin Davey is the only one who seems to be making a living from trading but with the draw downs reported about his system in the comments selling “education” would offer a much more stable income that his trading does. Most people reading this would do some thinking for themselves before they started hurling insults of talking out of their a** Go away troll, crawl back under your rock with Pete, Toto and the other disturbed voices in your head.
Thank you for finally actually answering my question. I wish you had done that the first time I asked, instead of avoidance and immediately attacking (“what other conclusion can be reached?”). I accept your unspoken apology. Let us keep it civil mate.
I wouldn’t expect anything other that you trying to distort the facts about the exchange between you and I. You did this in the posts between yourself and dtchurn, between yourself and Rob B and now you are trying to do it again. The first person to begin an uncivil exchange between us was you, but “I guess when you just talk out yo a** you can draw any crazy conclusion you want.” Sound familiar does it?
Stray Dog,
You the Man! He truly is unbelievable. I experienced it first hand. He takes taking things out of context to a new extreme. He literally is 99% fact free and just makes up something and then post it as facts. So you are then responding to some made up fact less post.
He really earns his title of being willfully stupid.
Hopefully, you are talking about me. Lol.
Batten down the hatches Rob B maybe even consider a trip north. Stay safe. Apologies to readers for this off topic post.
Thanks Stray, I will!
@ dtchum
Please stop insulting noble apes by comparing them to that poster.
Whoops. I guess cat is out of the bag now.
Stray,
I cannot believe you remember. Here is a photo from this morning when I went to get sandbags. It was a mad house. Most gas stations out of gas and forget about getting the high end gas. And HD and Lowes packed with folks buying plywood. All the OSB stuff is gone so folks buying whatever wood they can find, some out of desperation are buying rigid insulation boards.
Well I am sure DTChum will be happy as I will more than likely be wiped off the face of the map in a short period of time. I am practicing my backstroke.
My prayers go out to anyone in IRMA path.
Hey, I might think you are an arrogant know it all wannabe Emmett, and I think the site would be better without your “contributions” in the comment section — But I’d never wish anything bad like Irma on you. Stay safe and good luck.
I appreciate your thoughts being with the folks in Florida and others in IRMA’s path.
And you certainly might be right about the other stuff, but I do not agree with your assessment.
Shill after Shill post here after Emmett’s review stating how they are in the TR and making money hands over fist, yet when I and other confront them, they can show no proof what so ever. There only mission is to do and say whatever they can to scam folks out of their money.
You on the other hand never call out any of these shills but instead attack the poster that do call out the shills.
So IMHO for what every your reason might be you defacto support the TR operators.
Plus you clearly upvote your own post and down vote the person you oppose’s post. It is so obvious as I see the exact same pattern again and again. Right after you post there will be in a very short period of time a high up vote on your post and high down vote on other poster. This can only happen if you are doing the voting. But the funny thing, I also see again and again, as time goes on and other actually read your post they reverse your up voting.
Many people still believe there is some unicorn Day TR out there that is legit. But a few are getting off the Kool-Aide and realizing this whole industry is nothing but swindlers. No one that is able to consistently trade profitable is teaching anyone else to take his trades because he wants to give back. Maybe some day you too will come to realize this DTchum and have a different point of view. Until then the difference of opinion will continue.
And anyone interested in IRMA news I went out on the road this evening and it is a ghost town. The local Pep Boys was completely bordered up. It is so surreal (hopefully that is the right word) to watch.
Not sure why you must trade to teach others to trade. In my part of the world many great soccer coaches were meh as players.
and some did not play at all at any high level of competition – I guess they could be considered “sim traders” of the soccer world. But they certainly taught pros a lot of things.
A soccer coach may have been a mediocre player, BUT HE COULD actually play, so using your analogy, a so-called trading teacher should be able to demonstrate that he can actually trade to the objective, which is to be profitable.
To add to Cyn’s point above; the strategies being sold are simple and easy to automate so why wouldn’t they just automate the strategies and trade their own cash? Nothing to do with being a great trader, there are no decision to be made. Once the pattern presents you enter the trade so why not just do that and forget about the education side of it?
What proof do you have the author did not do as you say: “just automate the strategies and trade their own cash?” Your train of thought appears to still be boarding at the station: Without even knowing that answer, you then assume the author does not trade, then had to write a book for money, then therefore must be a fraud. Conspiracy theory much, mate?
Dtchum,
I am so busy these days barely have time to even see what going on at this site, but I had to respond to your comment as it is comparing apples to oranges.
Every industry has its own litmus test. Lets take Coaching. There are folks just wanting to play a sport for fun and just want a coach that knows how to play. I don’t think traders fall into that category. Then there on Olympic Athletes wanting to win the gold metal. In that case they are looking at coaches that have trained other Olympic gold medal winners, so it is easy to know who those coaches are. Those coaches are not saying I am a Olympic gold medalist (unless they were).
But these day TR con artist are claiming to be profitable traders, that is the difference and yet virtually none ( I personally think it is all of them) can show proof of their claims.
Now if a TR operator came out and stated, I can not trade worth shit, but I have trained thousands of successful traders, then they can show proof of that. Yet when I call out the shill, again not one of them can show proof of their claims.
The entire day trading industry is full of nothing but con artist who teach people to see patterns that are not there. They teach you to trade white noise, which is why even using lenient sim generators they can not trade profitable. Someday, you too will wake up from that powerful kool-aid and realize this to be true.
I’m waiting for the room Cyn is creating. I want to be a moderator. I can over promise and under deliver with the best of them. A new trader only needs 2gs to start micro scalping crude oil with 95% accuracy. With our calls, there will be weekly wires into our bank accounts as a salary with zero draw down. No need for books, strategies, and or software freezing up like GZT. It is just the veterans from Trading Schools calling out trades live on a daily basis. Hurry now and sign up because this offer has limited availability. We have 2 million subscribers and counting so hurry before the offer expires. It is currently half price!!!
Very good. Very good. You are now appointed the Senior Trading Executive Director. You need to up the blatant, nonsensical, promises a tad, and we shall make you Snakeoiler-in-Chief.
Can the code be imported to Think or Swim.
The code cannot be imported, but the rules are very clearly written, so they can be coded pretty easily in TOS. They have a room devoted to coding. Ask in there.
I no longer write in thinkscript, or I would have done it for us.
I do not see any rules for stop loss.
What was your stop loss rule for back testing ?
What’s the stop-loss rule?
Three Amazon reviews suggest theres no sl
Hi Emmet is this strategy also applicable to common stocks besides etfs? I have also noticed that the conditions mentioned above although they do have a high winning rate they rarely show up as a whole..Is this correct?
You can use it for stocks as well. But the whole point of these strategies is taking advantage of ETFs for being safer, a wee bit more predictable compared to conventional stocks. If you apply the strategy to stocks you might experience a lot more whipsaws. If you want to apply it to stocks, look for stocks with a large volume and i personally tend to only look at stocks which have Options or more specifically weekly-options.
Any individual stock will more than likely have greater risk than a several stocks that make up a sector. What might be interesting is instead of applying to a single ETF or sector, to use it across ETF sectors that do not normally correlate. It might reduce your overall gain, but provide for lower risk.
But I warn what worked in the past does not translate to the future. There are ETF created all the time to mimic a strategy that is suppose to outperform such as the Dog of the DOW ETFs.
I will give you my 2 cents worth and take it for the price paid. I would not trade any of these strategies. When you look at great investors they did not trade strategies. The trick to why they got rich was they understood what they were buying and they had the guts to buy investments when they are out of favor and sell when they become hot again. The problem with strategy investing is what happens if it corrects 30%, will you still hold or sell in a panic as you know had no reason to buy it except for its part of a strategy. And this applies to both Real Estate and Stocks.
I talk about Real Estate all the time so instead I will mention a stock. By the way no one should own a single stock, but a portfolio of stocks. I own Amazon, but I am not buying at Today’s prices. I have owned it for a long time and the reason I own it was I thought there strategy was ground breaking and disruptive. And since then they even have made it better. In the past you make a product and then sell it to retail for a 100% markup and then they resale it to us for another 100% markup. If you can bypass all that and sell direct to the customer, both the producer and end customers save money. This is the kind of disruptive practice I love!!! And then Amazon created Prime shipping and expanded their distribution centers. I can now order from them and get my package the next day or even sooner. As long as I see this type of innovation I will continue to own and buy Amazon when it has major corrections. The point is it is easier to hold an investment you understand, no matter what it be. If you know art, IMHO better to invest in art than some ETF trading strategy.
On the basis of the seemingly true observation that adding a Stop Loss causes a deterioration of the performance of any trading system, he now takes the dubious proposition that one should trade with no stop loss!
I, on the other hand, take the positioin that trading without a stop loss is a one way street to the busted account. I would rather accept a loss of performance than a loss of the account, but hey, that is just me.
OK, so there’s no SL. But is there some other method for limiting losses (eg position size: buy only as much as you can afford to lose, like 2% of your account), or is he playing Russian Roulette with his trading account?
I purposely left the stop loss out of the article. Why? I want readers to test!
Even with a relatively tight stop, the performance is excellent.
Test.
Hi Emmett
Can you please email me the strategy so I can import and try it out.
Thanks in advance.
Emmett – please send me the Trade Navigator strategies – I’d like to do some testing. For position sizing, do you know the max number of trades on at any given time during that test period?
Will do in the AM. Sorry I have been late to respond to requests these past two weeks–helping a friend fish his belongings from the streets of Houston Texas.
Thanks – best of luck with your work in Houston
Hi Emmet,
I downloaded the navigator from the link on this webpage.
I would like to test the strategy as well. Can you please send me
the code for this strategy and any other strategies you have?
Thank you for your great website. It’s been very useful for me.
He advises that stops for the most part are completely moot in terms of protecting you from overnight risk especially since these are not intraday strategies. The main premise of this strategy is that by focussing on ETFs (slightly more predictable than your run of the mill stocks) and utilizing a set of conditions with a highly probabilistic outcome, results should be good.
For protection he does say that options hedging and position sizing would be good to employ which I agree with.